
Keep figures small in size include graphic representations of confidence intervals whenever possible. Use tables to provide exact values use figures to convey global effects.Avoid inferring causality, particularly in nonrandomized designs or without further experimentation.When using inferential statistics, provide the descriptive statistics, confidence intervals, and sample sizes for each variable as well as the value of the test statistic, its direction, the degrees of freedom, and the significance level.Describe the assumptions for each procedure and the steps you took to ensure that they were not violated.Choose a minimally sufficient statistical procedure provide a rationale for its use and a reference for it.Explain the techniques you used to "clean" your data set.Explain your handling of missing data and why any missing data does not undermine the validity of your analysis. Explain how the actual analysis differs from the planned analysis. Report unanticipated events that occurred during your data collection.Interpretation of results is not appropriate in this section. Explain the data collected and their statistical treatment as well as all relevant results in relation to the research problem you are investigating.

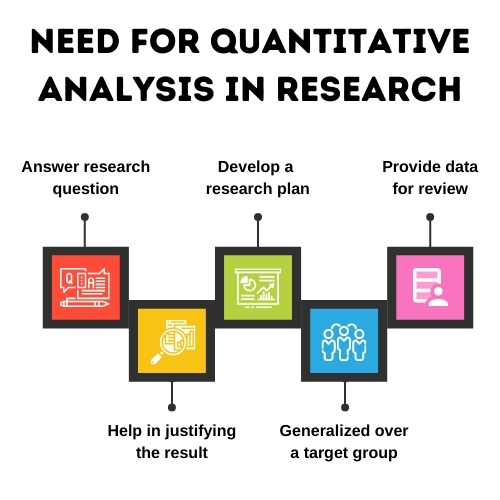
Things to keep in mind when reporting the results of a study using quantitative methods: The overarching aim of a quantitative research study is to classify features, count them, and construct statistical models in an attempt to explain what is observed. Researcher uses tools, such as questionnaires or computer software, to collect numerical data.Project can be used to generalize concepts more widely, predict future results, or investigate causal relationships.


 0 kommentar(er)
